Millions of yen
| 2019 | 2020 | 2021 | 2022 | 2023 | |
|---|---|---|---|---|---|
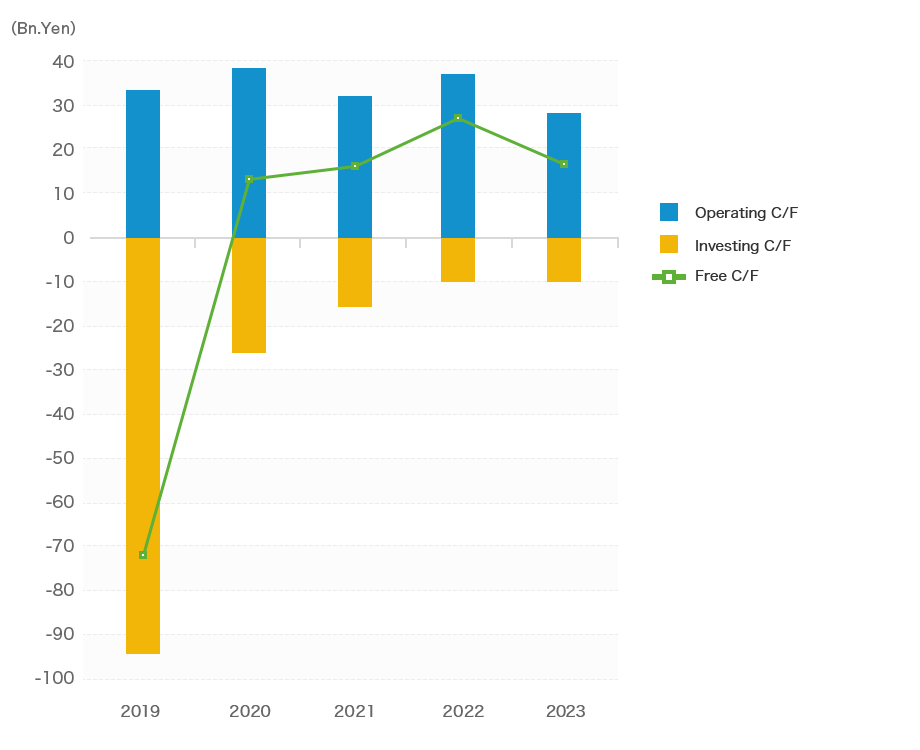
| Net cash provided by (used in) operating activities | 22,052 | 38,490 | 32,756 | 37,725 | 28,182 |
| Net cash provided by (used in) investing activities | (94,584) | (26,174) | (15,894) | (10,107) | (10,011) |
| Free cash flow | (72,532) | 12,316 | 16,862 | 27,618 | 18,171 |
| Net cash provided by (used in) financing activities | (8,557) | (6,587) | (9,160) | (11,259) | (13,260) |
| Cash and cash equivalents at end of year |
54,493 | 60,131 | 68,028 | 84,632 | 89,690 |
- *Information in the above tables is based on data from summary reports of consolidated financial results.
- *Free cash flow equal net cash provided by (used in) operating activities + net cash provided by (used in) investing activities.