Millions of yen
2019 P = 2019 Projection
| 2014 | 2015 | 2016 | 2017 | 2018 | 2019 (Projection) | |
|---|---|---|---|---|---|---|
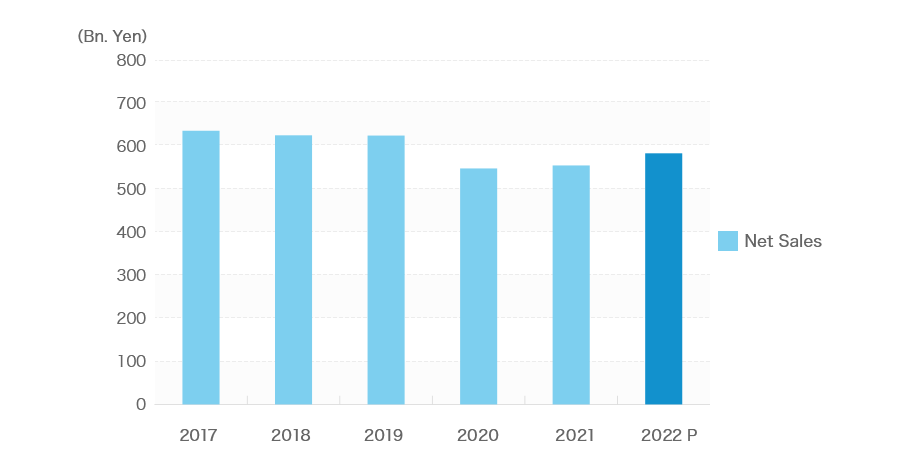
| Net sales | 659,432 | 646,002 | 629,313 | 632,189 | 621,591 | 623,000 |
| Gross profit | 233,536 | 233,104 | 226,007 | 223,771 | 218,173 | ― |
| % of sales | 35.4% | 36.1% | 35.9% | 35.4% | 35.1% | ― |
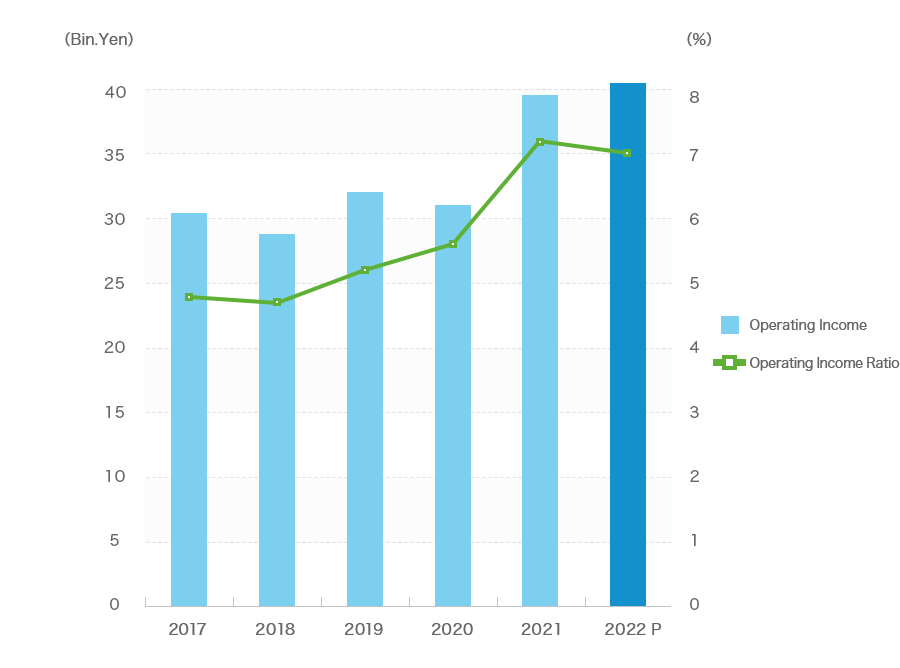
| Operating income | 25,087 | 26,647 | 27,676 | 30,406 | 28,941 | 31,000 |
| % of sales | 3.8% | 4.1% | 4.4% | 4.8% | 4.7% | 5.0% |
| Ordinary income | 26,553 | 28,040 | 28,717 | 31,491 | 30,519 | 32,200 |
| % of sales | 4.0% | 4.3% | 4.6% | 5.0% | 4.9% | 5.2% |
| Profit attributable to owners of parent | 16,030 | 15,670 | 18,161 | 20,679 | 20,826 | 21,500 |
- *Information in the above tables is based on data from summary reports of consolidated financial results.