Millions of yen
| FY2019 | FY2020 | FY2021 | FY2022 | FY2023 | ||
|---|---|---|---|---|---|---|
| Net sales | 621,134 | 545,060 | 552,085 | 588,132 | 609,473 | |
| Cost of sales | 420,107 | 361,077 | 361,809 | 388,842 | 404,980 | |
| Gross profit | 201,026 | 183,982 | 190,276 | 199,289 | 204,492 | |
| Selling, general and administrative expenses | 168,586 | 152,665 | 150,576 | 149,341 | 151,997 | |
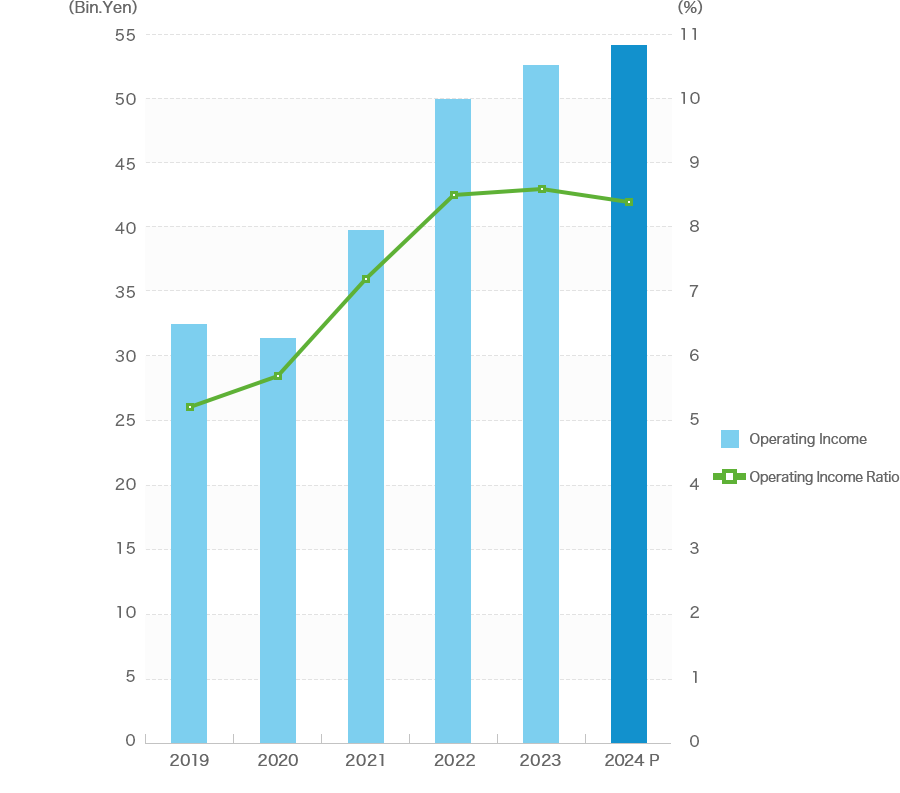
| Operating income | 32,439 | 31,317 | 39,699 | 49,947 | 52,495 | |
| Non-operating income | ||||||
| Interest income | 196 | 243 | 274 | 299 | 383 | |
| Dividend income | 154 | 155 | 283 | 209 | 237 | |
| Insurance income | 767 | 452 | 506 | 459 | 457 | |
| Foreign exchange gains | - | - | - | 29 | - | |
| Gain on investments in partnership | 247 | 231 | 278 | - | - | |
| Subsidies for employment adjustment | - | 2,744 | - | - | - | |
| Other, net | 302 | 279 | 220 | 227 | 213 | |
| Total non-operating income | 1,667 | 4,106 | 1,562 | 1,225 | 1,291 | |
| Non-operating expenses | ||||||
| Interest expense | 12 | 12 | 12 | 12 | 11 | |
| Loss on investments in partnership | - | - | - | 29 | 31 | |
| Foreign exchange losses | - | 5 | 6 | - | 6 | |
| Other, net | 157 | 169 | 146 | 139 | 152 | |
| Total non-operating expenses | 169 | 187 | 165 | 180 | 201 | |
| Ordinary income | 33,937 | 35,236 | 41,096 | 50,991 | 53,585 | |
| Extraordinary income | ||||||
| Gain on sales of long-lived assets | 13 | 283 | 6 | 3 | 3 | |
| Gain on sales of investments in securities | 2 | 278 | 1,255 | 729 | 113 | |
| Gain on sales of shares of subsidiaries and associates | - | - | 895 | - | - | |
| Insurance income due to disaster | - | - | 202 | - | - | |
| Other, net | - | 20 | 16 | 0 | - | |
| Total extraordinary income | 15 | 581 | 2,376 | 733 | 117 | |
| Extraordinary losses | ||||||
| Loss on sales and disposal of long-lived asset | 206 | 1,021 | 124 | 124 | 479 | |
| Loss on sales of shares of subsidiaries and associates | - | 737 | 40 | - | 159 | |
| Loss on sales of investments in securities | - | - | - | 18 | 2 | |
| Loss on impairment of investments in securities | 329 | 316 | 18 | 57 | - | |
| Loss on disaster | - | - | 168 | - | - | |
| Loss on impairment of fixed assets | 82 | - | - | - | - | |
| Loss on COVID-19 | - | 274 | - | - | - | |
| Other, net | 31 | 4 | 26 | 1 | 3 | |
| Total extraordinary losses | 649 | 2,355 | 377 | 202 | 645 | |
| Net income before income taxes | 33,302 | 33,463 | 43,094 | 51,523 | 53,057 | |
| Income taxes-current | 12,626 | 12,525 | 12,971 | 14,244 | 15,493 | |
| Income taxes-deferred | (1,663) | (1,133) | 627 | 1,652 | 980 | |
| Total income taxes | 10,963 | 11,392 | 13,598 | 15,896 | 16,473 | |
| Net income | 22,339 | 22,071 | 29,495 | 35,626 | 36,583 | |
| Net income attributable to non-controlling interests | 89 | 73 | 75 | 74 | 90 | |
| Net income attributable to owners of the parent | 22,250 | 21,997 | 29,420 | 35,552 | 36,493 | |

- *Information in the above tables is based on data from summary reports of consolidated financial results.