Millions of yen
| FY2019 | FY2020 | FY2021 | FY2022 | FY2023 | ||
|---|---|---|---|---|---|---|
| Cash flows from operating activities | ||||||
| Net income before income taxes | 33,302 | 33,463 | 43,094 | 51,523 | 53,057 | |
| Depreciation and amortization | 12,257 | 11,253 | 10,246 | 9,592 | 9,738 | |
| Loss on Impairment of fixed assets | 82 | - | - | - | - | |
| Amortization of goodwill | - | - | - | 29 | 198 | |
| Amortization of customer-related intangible assets | - | - | - | - | 303 | |
| Increase (decrease) in allowance for doubtful receivables | (66) | (179) | (242) | 111 | (7) | |
| Increase (decrease) in accrued pension and severance costs | 4,468 | 2,028 | (544) | (3,480) | (13,347) | |
| Decrease (increase) in prepaid pension and severance costs | (19) | (19) | (45) | (46) | 10,386 | |
| Contribution of cash to retirement benefit trust | - | - | - | - | (18,000) | |
| Increase (decrease) in accrued bonuses | (64) | 2,323 | (1,486) | (716) | (298) | |
| Interest and dividend income | (350) | (398) | (558) | (509) | (621) | |
| Interest expense | 12 | 12 | 12 | 12 | 11 | |
| Loss (gain) on sales and disposal of property, plant and equipment, net | 190 | (150) | 111 | 107 | 151 | |
| Loss (gain) on sales of investments in securities | (2) | (278) | (1,255) | (711) | (111) | |
| Loss (gain) on impairment of investments in securities | 329 | 316 | 18 | 57 | - | |
| Loss (gain) on sales of shares of subsidiaries and associates | - | 737 | (855) | - | 159 | |
| Loss (gain) on investments in partnership | (247) | (231) | (278) | 29 | 31 | |
| Decrease (increase) in notes and accounts receivable | 4,857 | 5,276 | (1,987) | (2,894) | (61) | |
| Decrease (increase) in inventories | (1,805) | 5,357 | (7,467) | (3,280) | (691) | |
| Increase (decrease) in notes and accounts payable-trade | (24,301) | (6,262) | 2,222 | 985 | (2,503) | |
| Other, net | 4,038 | (1,567) | 4,332 | 241 | 3,992 | |
| Subtotal | 32,683 | 51,682 | 45,317 | 51,051 | 42,389 | |
| Interest and dividends received | 346 | 394 | 555 | 506 | 614 | |
| Interest paid | (12) | (12) | (12) | (12) | (11) | |
| Income taxes paid | (10,965) | (13,574) | (13,103) | (13,820) | (14,809) | |
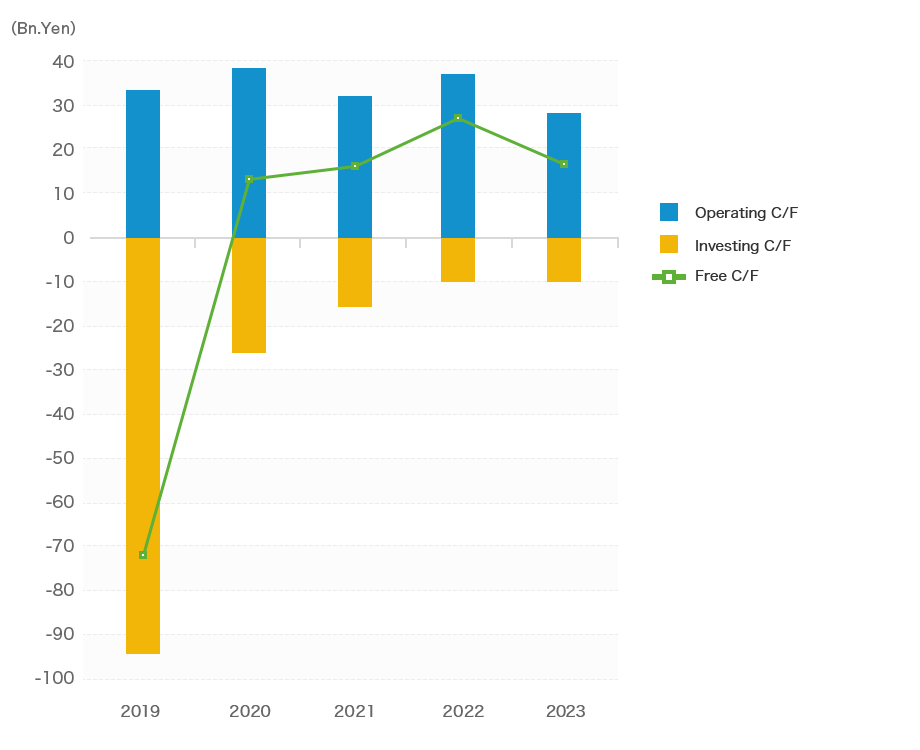
| Net cash provided by operating activities | 22,052 | 38,490 | 32,756 | 37,725 | 28,182 | |
| Cash flows from investing activities | ||||||
| Payments for purchases of property, plant and equipment | (11,651) | (14,695) | (14,587) | (8,889) | (8,343) | |
| Proceeds from sales of property, plant and equipment | 16 | 1,010 | 18 | 23 | 19 | |
| Payments for purchases of intangible assets | (1,450) | (3,729) | (2,242) | (894) | (1,960) | |
| Payments for purchases of investments in securities | (1,383) | (310) | (1,089) | (676) | (743) | |
| Proceeds from sales of investments in securities | 328 | 697 | 1,893 | 1,330 | 244 | |
| Payments for purchases of shares of subsidiaries | - | - | - | (209) | (7,618) | |
| Proceeds from sales of shares of a subsidiary | - | 828 | 847 | - | - | |
| Decrease (increase) in short-term loans receivable, net | (79,997) | (9,994) | 2 | 11 | 10,012 | |
| Payments for acquisition of businesses | - | - | - | - | (750) | |
| Other, net | (446) | 19 | (737) | (802) | (872) | |
| Net cash used in investing activities | (94,584) | (26,174) | (15,894) | (10,107) | (10,011) | |
| Cash flows from financing activities | ||||||
| Repayments of finance lease obligations | (109) | (72) | (61) | (56) | (12) | |
| Payments for purchases of additional shares of a subsidiary | - | - | - | - | (260) | |
| Payments for purchases of treasury stock | (2) | (2) | (2) | (4) | (5) | |
| Dividends paid | (8,426) | (6,485) | (9,073) | (11,020) | (12,961) | |
| Dividends paid to non-controlling interests | (15) | (26) | (21) | (23) | (22) | |
| Other, net | (2) | 0 | - | (155) | - | |
| Net cash used in financing activities | (8,557) | (6,587) | (9,160) | (11,259) | (13,260) | |
| Effect of exchange rate changes on cash and cash equivalents | 11 | (91) | 195 | 245 | 147 | |
| Net increase (decrease) in cash and cash equivalents | (81,077) | 5,637 | 7,897 | 16,603 | 5,058 | |
| Cash and cash equivalents as of beginning of year | 135,571 | 54,493 | 60,131 | 68,028 | 84,632 | |
| Cash and cash equivalents as of end of year | 54,493 | 60,131 | 68,028 | 84,632 | 89,690 | |
- *Information in the above tables is based on data from summary reports of consolidated financial results.
- *Free cash flow equal net cash provided by (used in) operating activities + net cash provided by (used in) investing activities.